
Estimados amigos de Inseguros !!!
En el post de hoy voy a contar una vez más alguna cosita sobre Mitre Att@ck. Como sabeis es algo que manejo a diario y me gusta bastamte. Mi anterior artículo quizás sea una buena introducción.
La nutshell sería: un marco de referencia en donde enumerar y describir técnicas, tácticas y procedimientos que emplean los cibercrimiales, asociando la parte defensiva y ofensiva.
Dicho como en mi pueblo, todos los ataques que hacen los malos, y como defendernos.
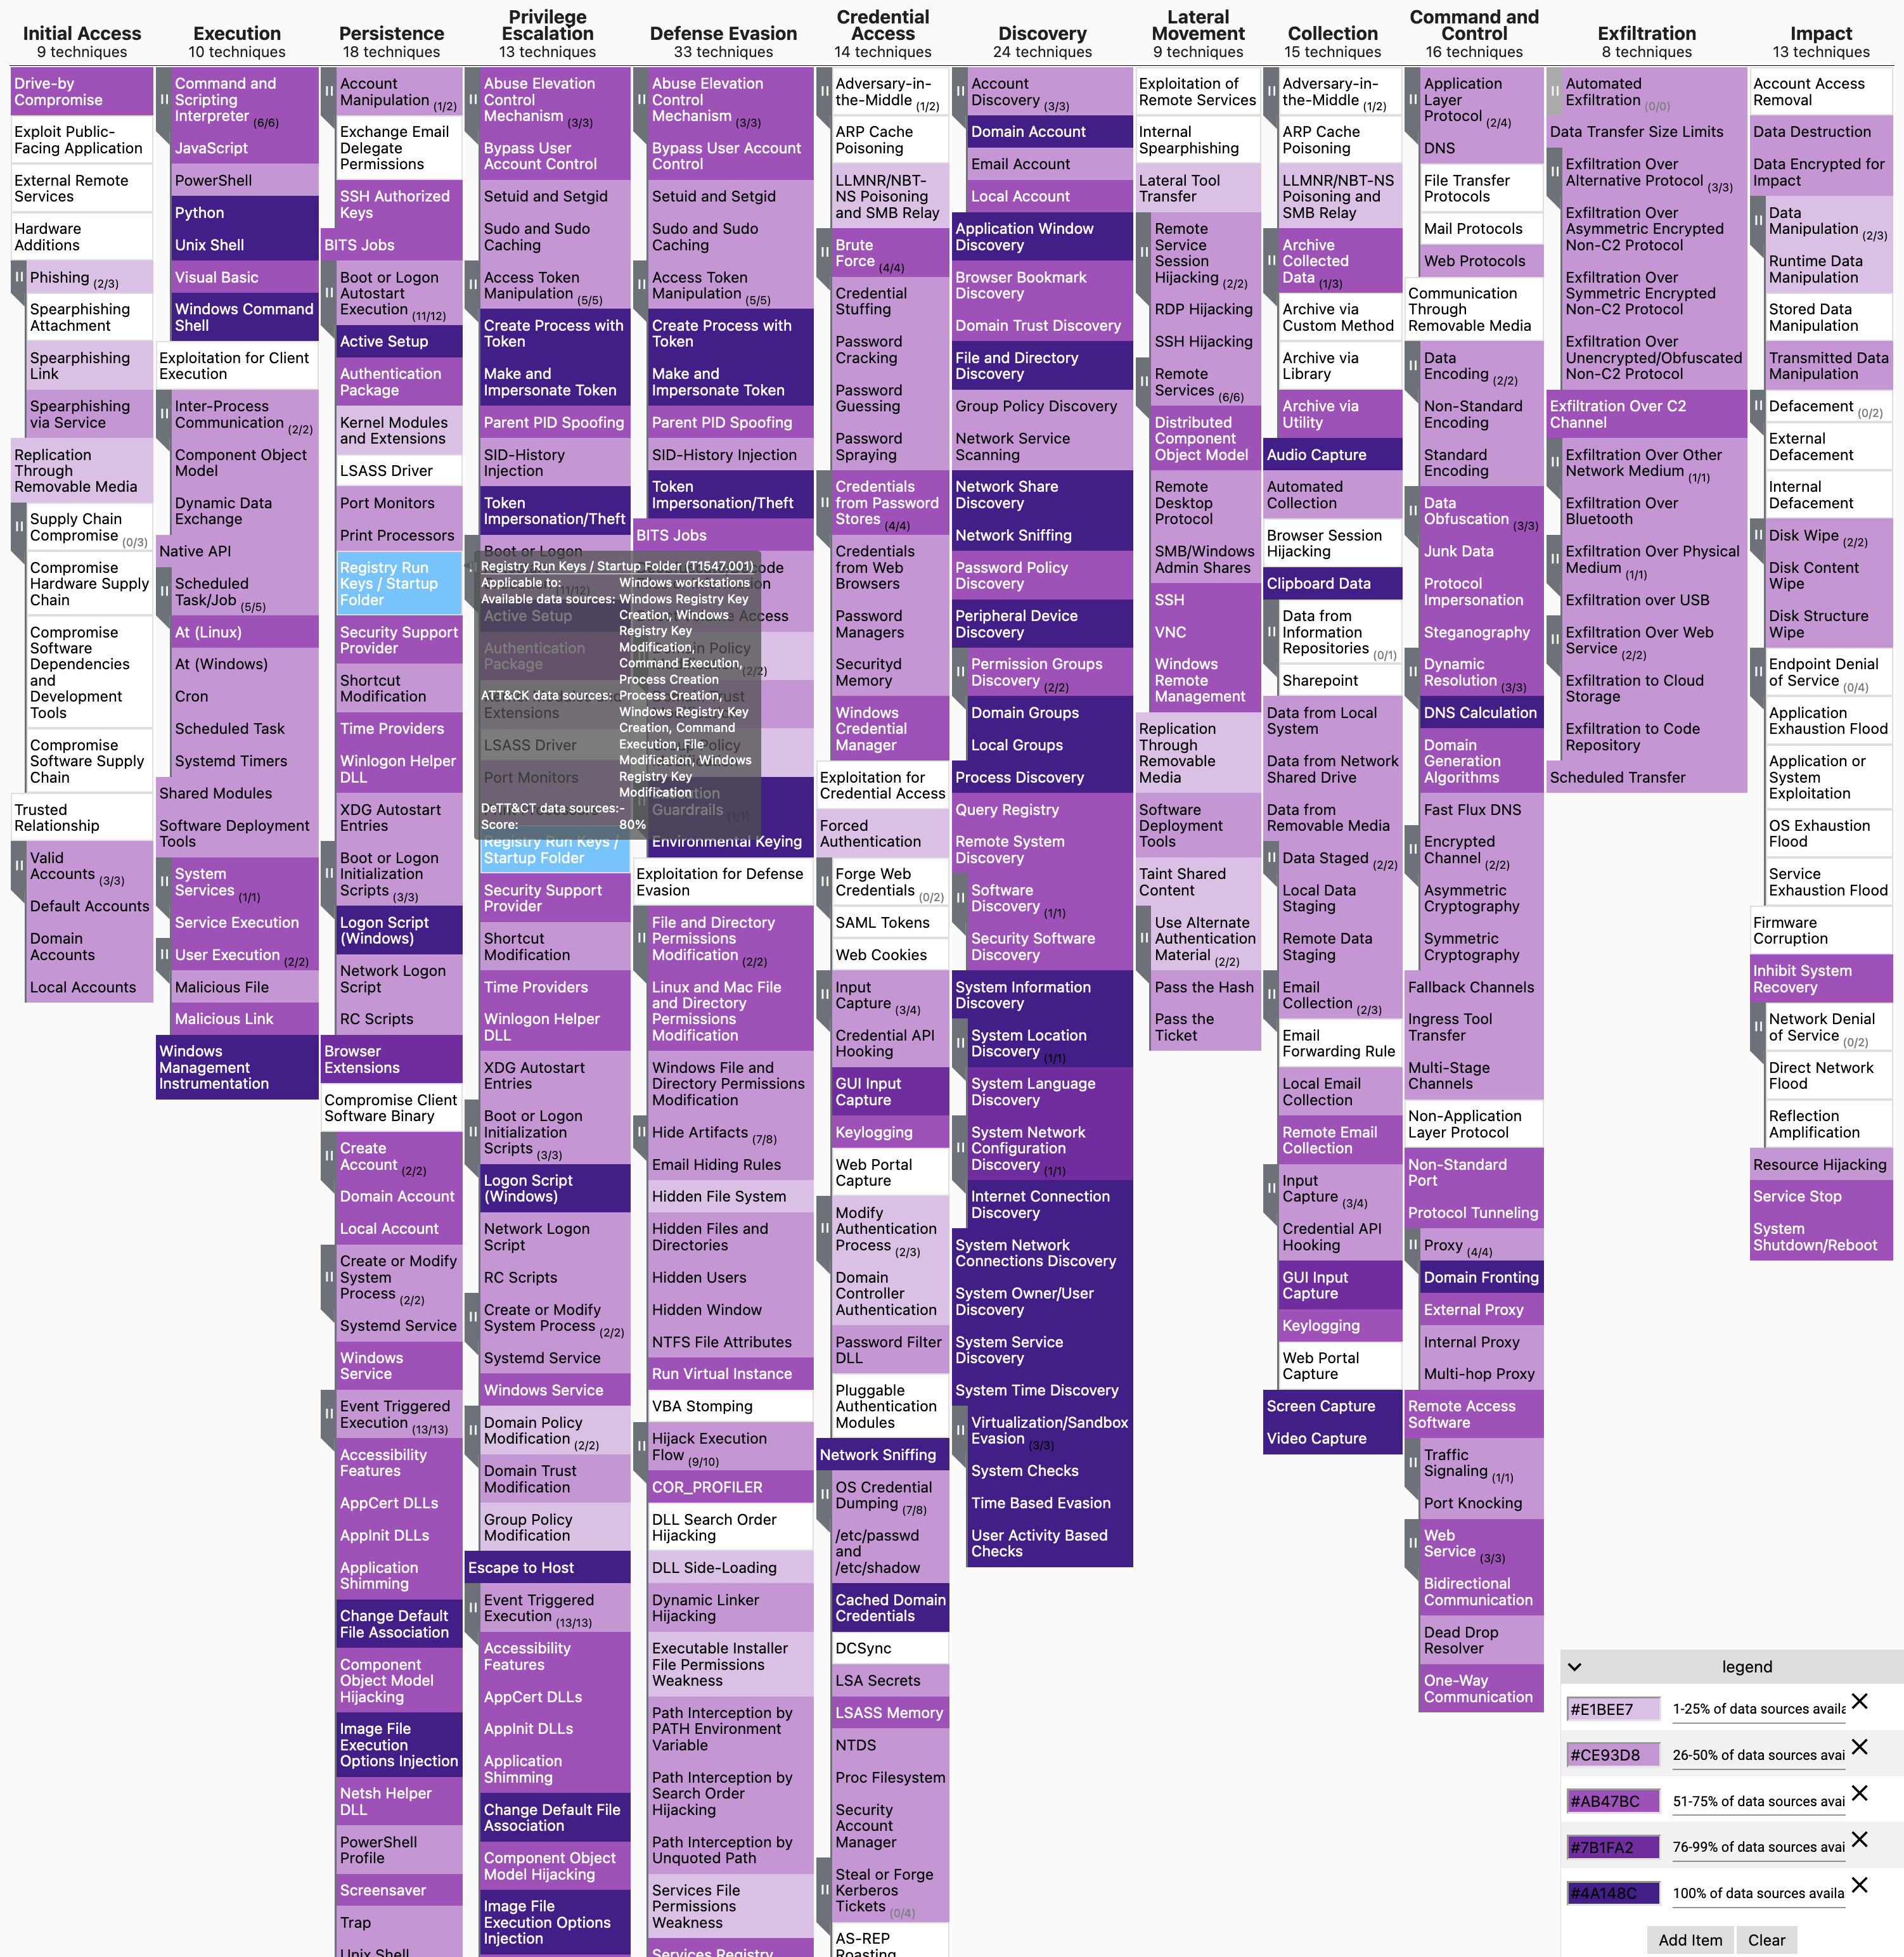
Como sabes, hay un mapa navegable en el que podemos interactuar con la matriz, indicando Scores, colores, textos... Al final es muy útil tener visialmente un mapa del estado de mi organización, según el grado de cobertura ante los ataques conocidos.
Por ejemplo, el T1196 Control Panel Items nos indica que hay una técnica de ataque que usan los malos para enviarnos ficheros en formato CPL y poder ejecutar payloads. Bien, nos indica que la manera de protegernos ante este ataque es la monitorización de procesos y una lista de apps permitidas y una política de negación.
Ahora yo me auto-evaluo y pienso, tengo estas dos medidas? La monitorización de procesos si, porque uso Sysmon, pero no tengo Applocker o similar. Para mi estudio, tengo un 50% de cobertura ante este TTP.
Me voy a la matriz y pinto ese TTP con un naranja, por ejemplo, porque para mi rojo es que lo tengo todo mal, y verde todo bien.
Así con todos los TTP.. me permite tener ese mapa.
Aquí es donde entra el proyecto DeTTect que os quiero traer hoy.
Un proyecto, un frontend que me genera capas de la Matriz Mitre en formato json pero con un GUI que permite elegir el grado de "cobertura" del ttp en base a Data Sources. Mucho más sencillo. Si yo tengo el Data source Monitor de Procesos sysmon a tope, la herramienta rellena las TTP correspondientes.
Pongamos un ejemplo gráfico para ilustrar el asunto. Vamos a configurar nuestro nivel de cobertura, lo "bien" que lo hacemos, para la monitorización de procesos, por ejemplo, si usamos Sysmon o similar.

Podemos configurar de 1 a 5 distintos parámetros, por ejemplo, tenemos Sysmon instalado en todos los equipos? retenemos los datos lo suficiente, tienen un formato estándar que me permita correlar/comparar con otros data sources... aquí tienes la definición de las 5 métricas.
| Dimensions | Description | Questions? | Example |
|---|---|---|---|
| Device completeness | Indicates if the required data is available for all devices. | When doing a hunting investigation can we cover all devices/users that we need to? | We are missing event data for endpoints running an older version of Windows. |
| Data field completeness | Indicates to what degree the data has the required information/fields, and to what degree those fields contain data. | Are all the required data fields in the event present and contain data to perform my investigation? | We have proxy logs, but the events do not contain the "Host" header. |
| Timeliness | Indicates when data is available, and how accurate the timestamps of the data are in relation to the actual time an event occurred. | Is the data available right away when we need it? Do the timestamps in the data represent the time the record was created or ingested? | We have a delay of 1-2 days to get the necessary data from all endpoints into the security data lake. Timestamps are representing not the time an event occurred, but ingestion time in the security data lake. |
| Consistency | Says something about the standardisation of data field names and types. | Can we correlate the events with other data sources? Can we run queries across all data sources using standard naming conventions for specific fields? | Field names within this data source are not in line with that of other data sources. |
| Retention | Indicates how long the data is stored compared to the desired data retention period. | For how long is the data available? How long do you want to keep the data? | Data is stored for 30 days, but we ideally want to have it for 1 year. |
| Score | Device completeness | Data field completeness | Timeliness | Consistency | Retention |
|---|---|---|---|---|---|
| 0 - None | Do not know / not documented / not applicable | Do not know / not documented / not applicable | Do not know / not documented / not applicable | Do not know / not documented / not applicable | Do not know / not documented / not applicable |
| 1 - Poor | Data source is available from 1-25% of the devices. | Required fields are available from 1-25%. | It takes a long time before the data is available. The timestamps in the data deviate much from the actual time events occurred. | 1-50% of the fields are standardised in name and type. | Data retention is within 1-25% of the desired period. |
| 2 - Fair | Data source is available from 26-50% of the devices. | Required fields are available from 26-50%. | Data retention is within 26-50% of the desired period. | ||
| 3 - Good | Data source is available from 51-75% of the devices. | Required fields are available from 51-75%. | It takes a while before the data is available, but is acceptable. The timestamps in the data have a small deviation with the actual time events occurred. | 51-99% of the fields are standardised in name and type. | Data retention is within 51-75% of the desired period. |
| 4 - Very good | Data source is available from 76-99% of the devices. | Required fields are available from 76-99%. | Data retention is within 76-99% of the desired period. | ||
| 5 - Excellent | Data source is available for 100% of the devices. | Required fields are available for 100%. | The data is available right away. The timestamps in the data are 100% accurate. | 100% of the fields are standardised in name and type. | Data is stored for 100% of the desired retention period. |

Como puedes ver, de una manera "amigable" puedo rellenar el estado de ese dataset.
Ahora cargamos el fichero resultante en nuestra matriz de navegación Att@ck y podemos ver de una manera gráfica y visual el estado de cobertura.

Pero atención, podemos hacerlo a la inversa, podemos usar en vez de referencia el Data Source, podemos usar el TTP, es decir, podemos indicar puntualmente el grado de cobertura que tenemos para una técnica concreta. En este ejemplo, vamos a tomar la matriz de O365, para seleccionar un TTP.

Me parece brutal el esfuerzo por ayudarnos a mantener un mapa actualizado, o al menos para hacer una carga inicial, una auditoría, una valoración.
Ahora vamos con la pelea. La instalación es muy sencilla: Docker.
El funcionamiento es muy sencillo. Una vez dentro del contenedor, ejecutamos el editor, lo que nos levanta el servicio web:
root@020752e06d54:/opt/DeTTECT# python dettect.py editor
Editor started at port 8080
You can open the Editor on: http://localhost:8080/
Con esto creamos el YAML. Ahora tenemos que convertilo en Json para poder cargarlo como layer en nuestro Att@ck.:
python dettect.py ds ./input/data.yaml -l --health
Espero que te guste el proyecto y lo uses de buena fe :-)
Gracias por leerme !!!
Y si te gusta este contenido, te animo a que te registre para estar al día de nuevos post, cursos, webinars, eventos etc.